
Cortex
A clinical AI product site built to make a risk-prediction model legible to the people who'd have to trust it.
Visit live site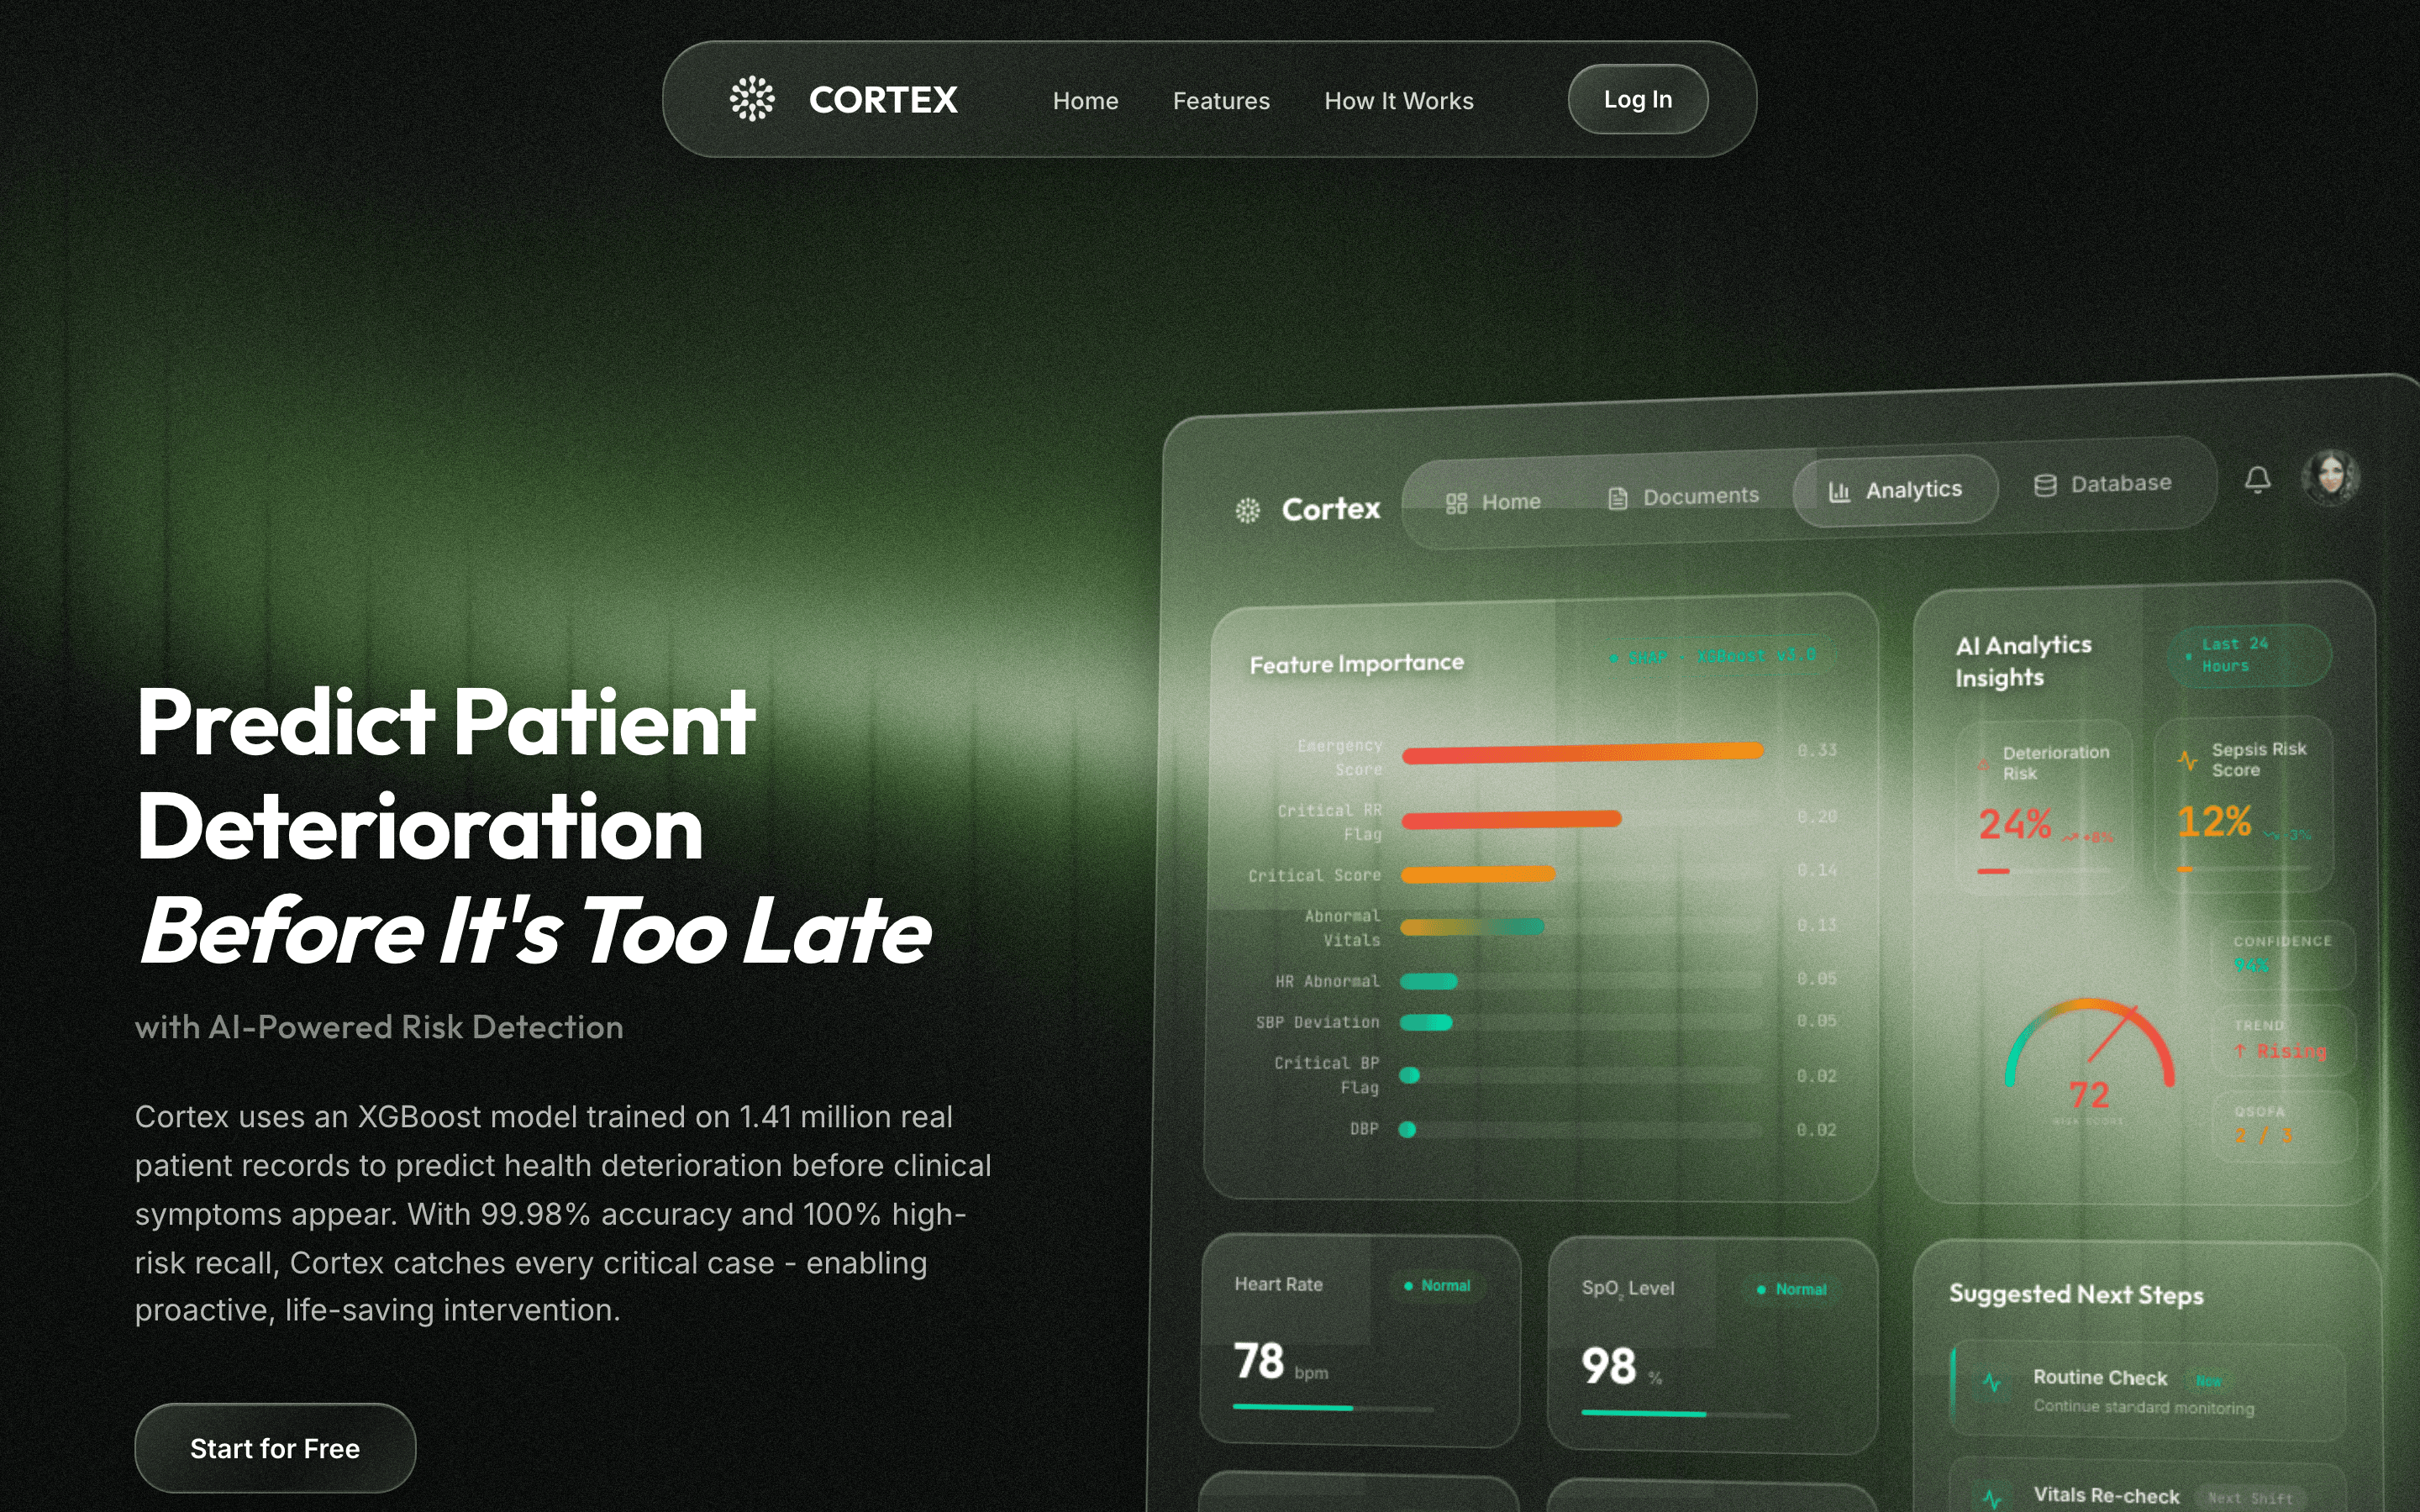
- Client
- Google Student Ambassador Program
- Industry
- Healthcare · Clinical AI
- Project type
- Product site & dashboard demo
- Year
- 2026
- Services
- UX StrategyUI DesignDashboard DesignFront-end DevelopmentData VisualisationDeployment
- Built with
- ReactViteReact RouterLucideVercel
The business
Cortex is a clinical AI product that predicts patient deterioration from vitals and history, built under the Google Student Ambassador Program.
Its site had to do something unusual for a product page: make a risk-prediction model legible to the clinicians who would have to trust it, before making any claim about how good it is.
The challenge
Predictive clinical software has a credibility problem before it has a marketing problem. Clinicians will not act on a risk score they cannot interrogate, so a page that leads with accuracy claims argues the wrong point. The site had to show what the model weighs and how a prediction turns into a next step.
The approach
The interface leads and the copy follows. A dashboard preview sits beside the headline showing feature importance, a live risk score, and suggested next steps, so the explainability argument is visible before it is stated. The page is then structured as an argument — the failure of reactive care first, the product second.
Lead with the interface
A dashboard preview beside the headline, so the explainability argument is visible before it is stated.
Make the inputs visible
A feature-importance ranking shows what the model weighs, and the vitals it reads - heart rate, SpO2 - sit alongside.
Explain the analytics
An AI analytics panel puts the model's reasoning next to its output rather than behind it.
Show the score
A risk-score gauge gives the prediction a shape a clinician can read in a second.
Connect prediction to action
A suggested-next-steps panel turns a number into a clinical decision, which is the point of the product.
Structure the argument
The page then runs as an argument - the failure of reactive care first, the product second, the hard questions answered in the FAQ.
What we worked on
- Dashboard demo
- Feature-importance chart
- AI analytics insights
- Risk-score gauge
- Heart rate and SpO2 readings
- Clinical workflow
- Suggested next steps panel
- Four-step onboarding walkthrough
- Product site
- Four-card problem framing
- Feature set section
- In-action section
- FAQ on accuracy, inputs, speed and safety
- Visual system
- Dark clinical interface in deep green
- Glass dashboard panel
- Build
- React and Vite front end
- React Router
- Deployed on Vercel
The solution
A dark clinical interface in deep green, anchored by an interactive dashboard preview. Below it, a four-part framing of the problem, a four-step onboarding walkthrough, the feature set, an in-action section, and an FAQ that takes the hard questions directly.
- Vitals in
- Feature importance
- Risk score
- Analytics
- Next step
Business value delivered
A product site that makes an AI prediction interpretable instead of merely impressive - credibility built by showing the working, not by asserting accuracy.
- Predictions that are easier to interpret at a glance
- Stronger product credibility with a sceptical clinical audience
- A clear picture of the workflow from data to decision
- The hard questions - accuracy, inputs, safety - addressed on the page

Let's build something worth visiting.
Tell us what you're building and what it needs to do. We'll come back with next steps, a scope, and a fixed quote.
Or email hello.luminixsolutions@gmail.com