
eBPF-Swarm
An operations console for an autonomous Kubernetes self-healing operator.
Visit live site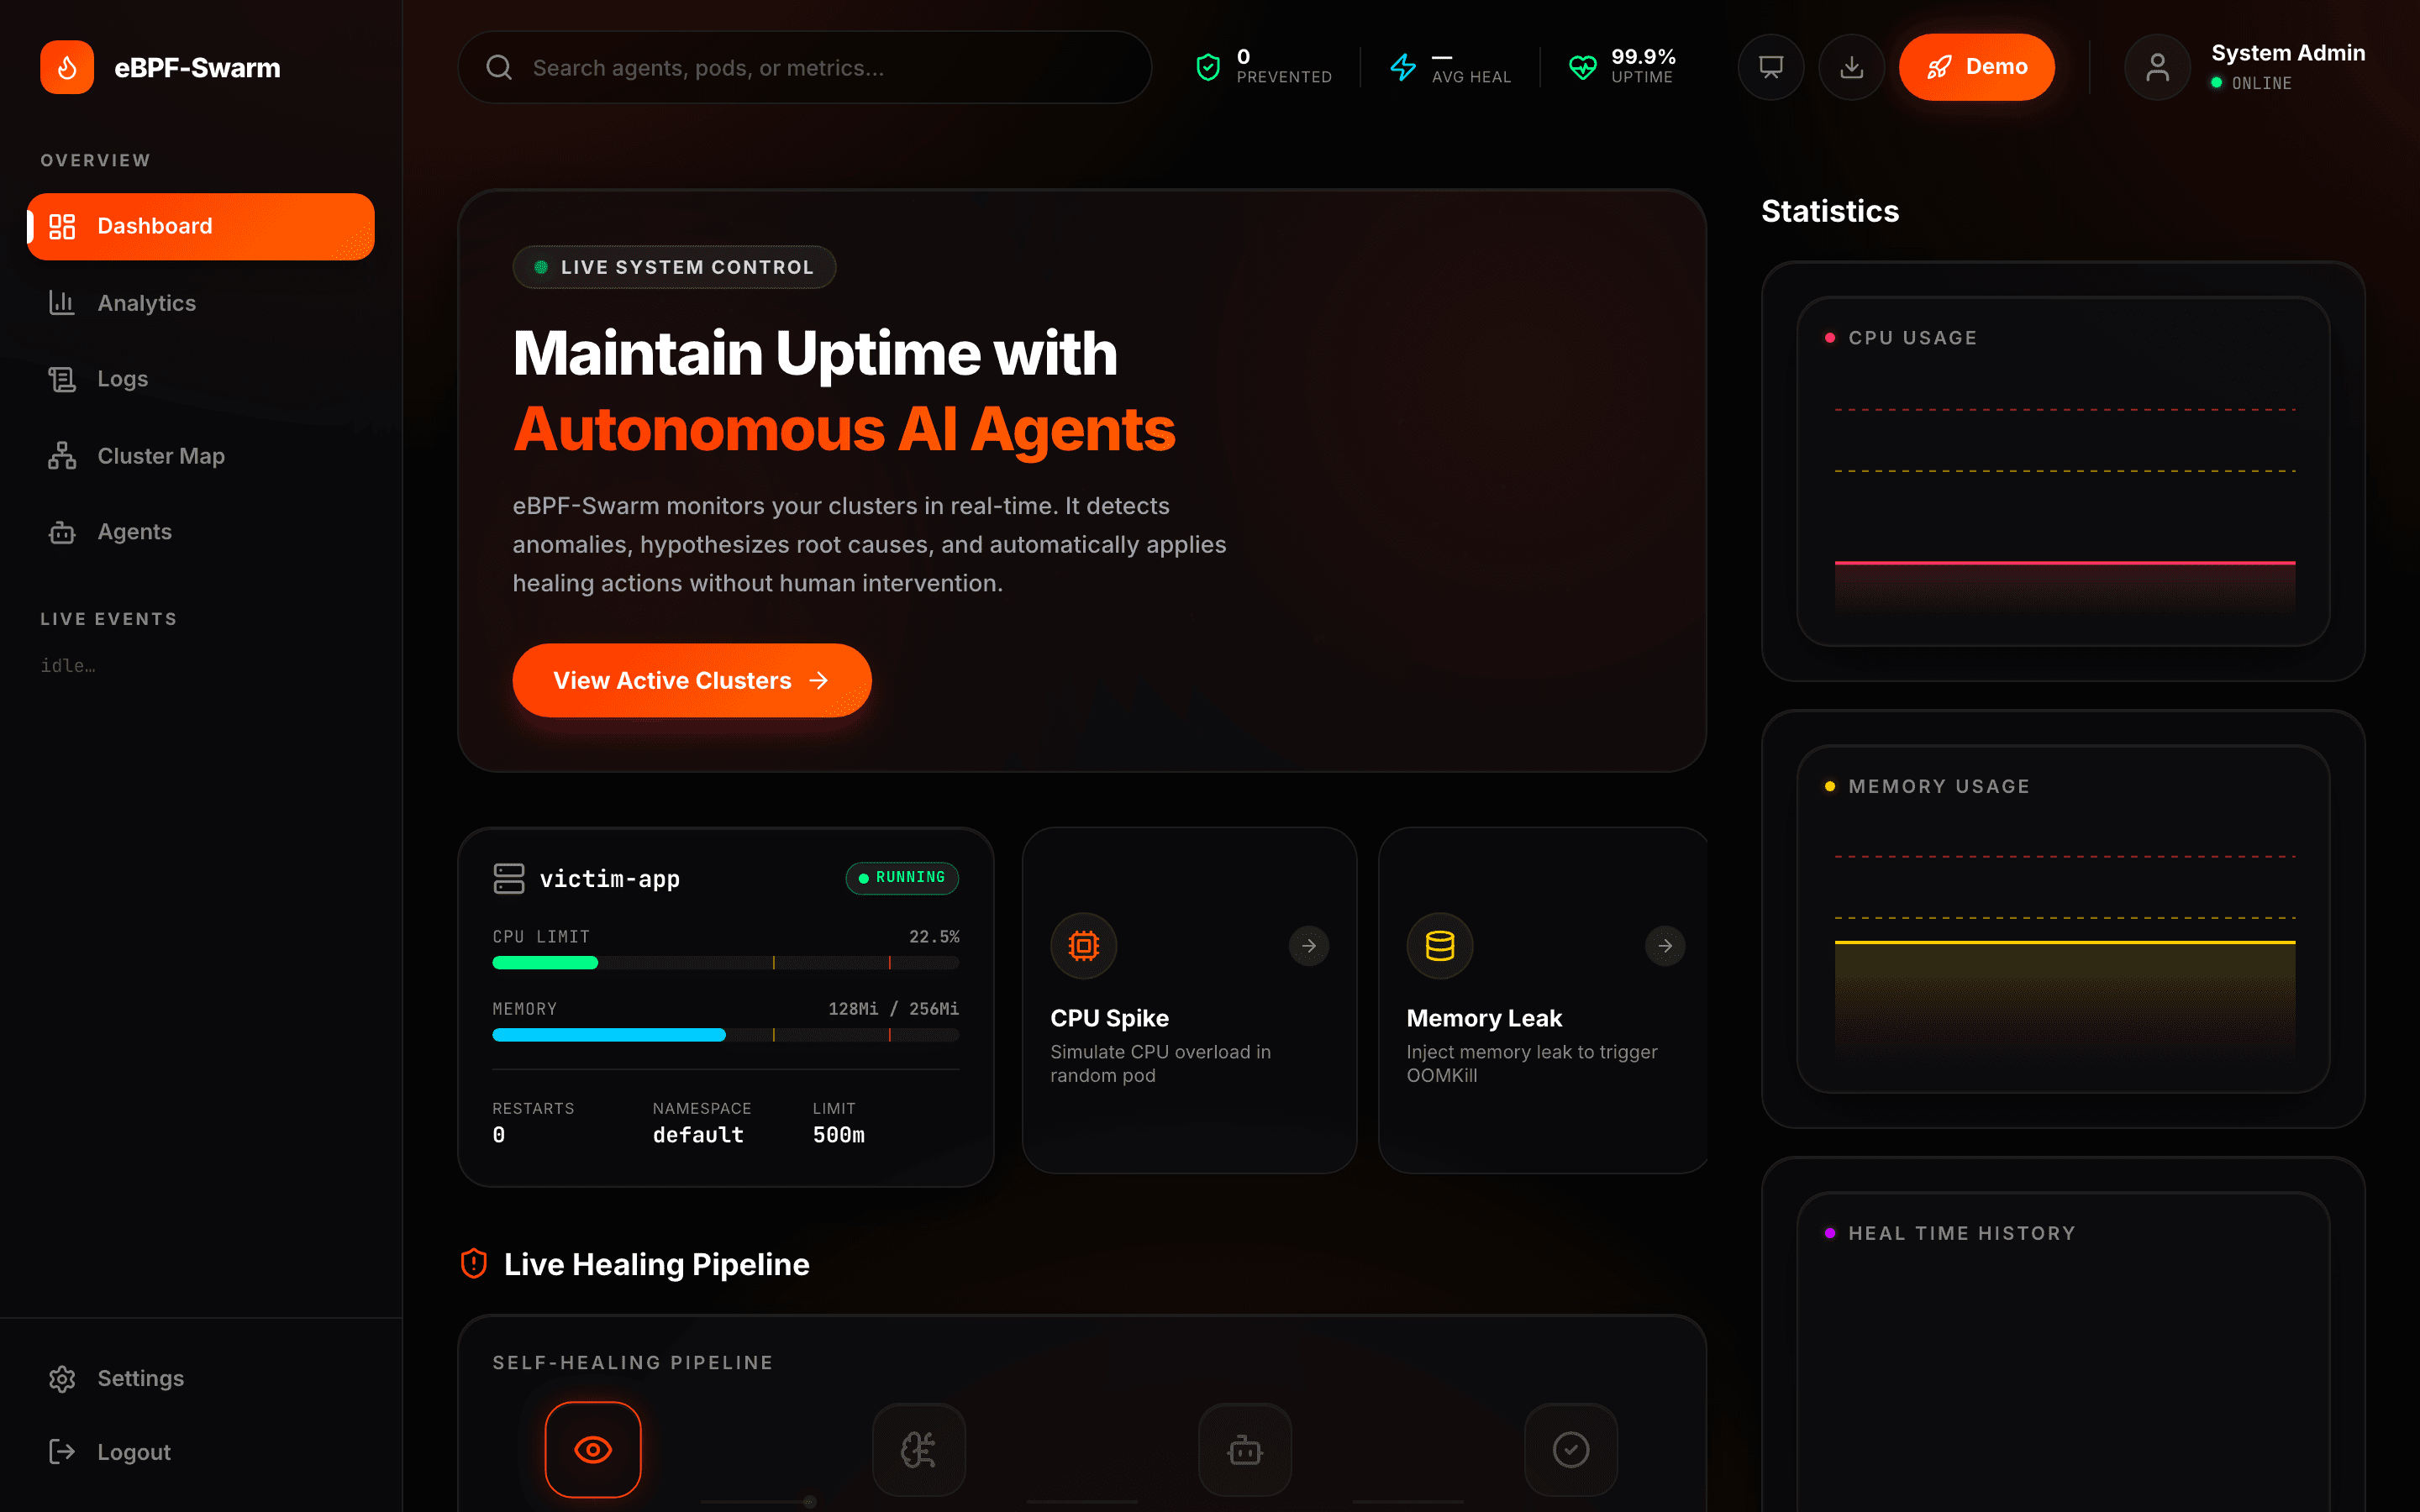
- Client
- Faraway
- Industry
- Developer tooling · Cloud infrastructure
- Project type
- Product interface & live demo
- Year
- 2026
- Services
- UX StrategyUI DesignDashboard DesignFront-end DevelopmentData VisualisationDeployment
- Built with
- ReactViteFramer MotionLucideVercel
The business
eBPF-Swarm is an autonomous Kubernetes self-healing operator: it watches a cluster, diagnoses a failing workload and resolves it without a human in the loop. The product website doubles as its operations console.
The interface has to make cluster state, monitored pods, CPU and memory telemetry, fault injection, the operator's autonomous actions and the recovery status all legible at once - to an audience of engineers who will judge it on precision.
The challenge
Autonomous infrastructure tooling is difficult to sell and difficult to trust. A cluster operator that acts without human intervention has to show its reasoning, or engineers will not hand over control. Static screenshots and feature lists do not carry that argument.
The approach
Rather than describe the product, the site runs it. The interface is built as a working operations console with fault injection controls, so a visitor can trigger a real failure and watch the system diagnose and resolve it. The design goal was legibility under motion - dense telemetry that stays readable while it updates.
Simplify the complexity
Reduced a dense operational picture to one narrative a visitor can follow: detect, diagnose, heal.
Information hierarchy
Ordered every panel by what an engineer needs first - the monitored pod and its state, then telemetry, then the agents acting on it.
Make monitoring visible
Put live CPU, memory and heal-time telemetry on the page rather than describing it, so the monitoring is the demonstration.
Surface the autonomous actions
Gave the planner, evaluator and executor roles their own activity panel, so the system's decisions are visible as they happen.
Keep developer credibility
A dark, high-density console aesthetic with dense but readable telemetry - the language engineers already trust.
What we worked on
- Dashboard UI
- Operations console layout
- Persistent sidebar navigation
- Dashboard, analytics, logs and cluster map views
- Monitoring
- Monitored pod card with state
- CPU and memory meters
- Real-time telemetry charts
- Fault injection
- CPU spike, memory leak and network delay controls
- Trigger a real failure on demand
- Autonomous agents
- Snitch, Brain, Swarm, Healed pipeline visualisation
- Planner, evaluator and executor activity panel
- Alerting
- Live alert feed
- Filter by severity and resolution state
The solution
A dark, high-density dashboard interface organised around a single narrative: detect, diagnose, heal. Live telemetry, an agent pipeline visualisation, and a filterable alert feed sit alongside demo controls that let a visitor inject faults on demand.
- Detect
- Diagnose
- Heal
- Telemetry
- Alert feed
- Agent activity
Business value delivered
A product site that argues its own case: instead of claiming the operator works, it lets a visitor break a cluster and watch it recover.
- Cluster state, telemetry and recovery readable at a glance
- Technical credibility with the engineers who decide on tooling
- Faster understanding of what the system is doing, and why
- A stronger demonstration than screenshots or a feature list could give
Let's build something worth visiting.
Tell us what you're building and what it needs to do. We'll come back with next steps, a scope, and a fixed quote.
Or email hello.luminixsolutions@gmail.com